Ezoic EPMV Chart - Learn How To Optimize Your Site's Revenue

- What is EPMV
- Why CPC and CPM rates are not enough for publishers
- How to Calculate Ezoic EPMV
- Benefits of EPMV
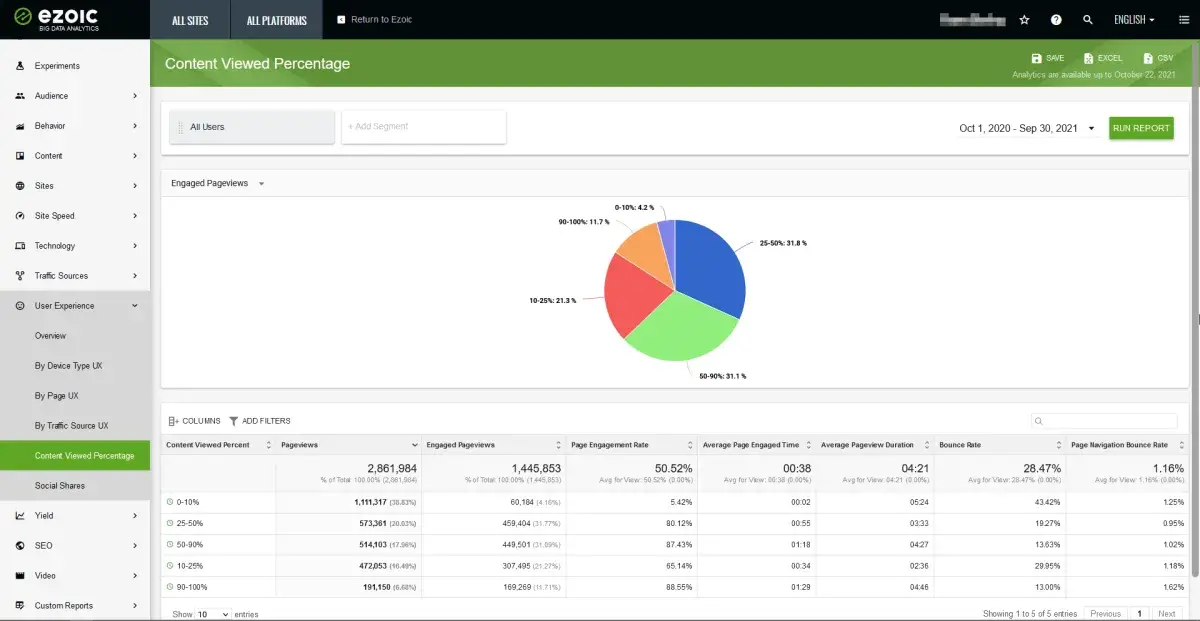
- What is Ezoic EPMV Chart
- EPMV Per Location
- EPMV Per Visitor
- Factors Outside The Publisher's Control
- Factors Within The Publisher's Control
- Factors OUTSIDE the publisher's control
- 1) The Season or Month impacting your Ezoic EPMV Chart
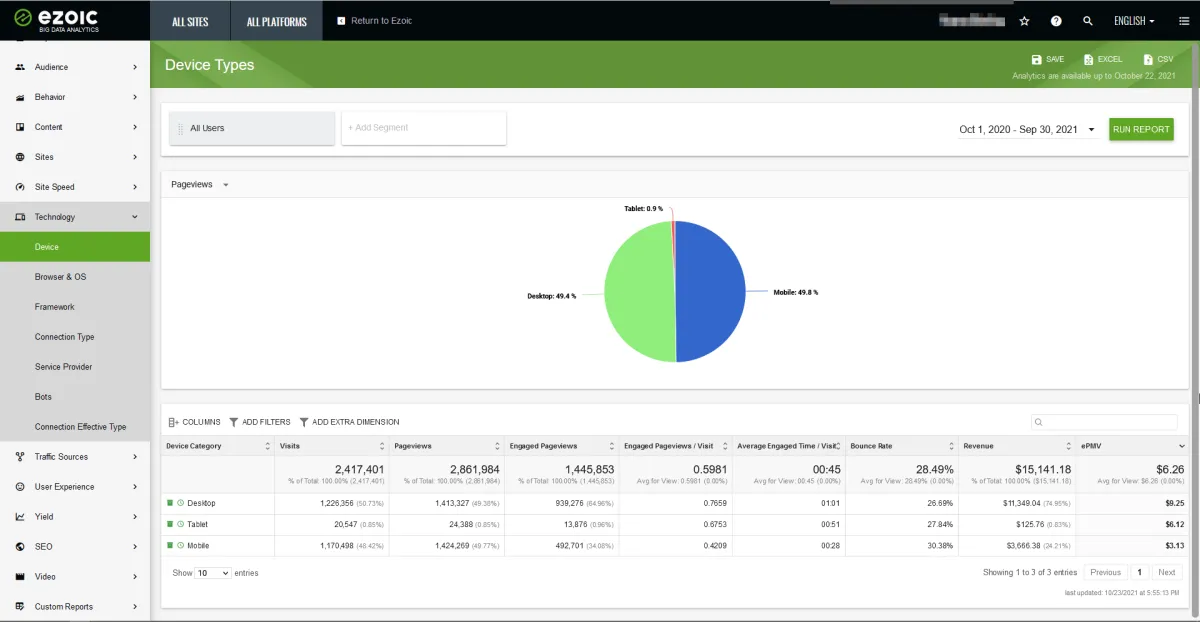
- 2) The visitor's device type impacting your Ezoic EPMV Chart
- 3) The Ezoic EPMV Chart is impacted by the traffic source of visitors
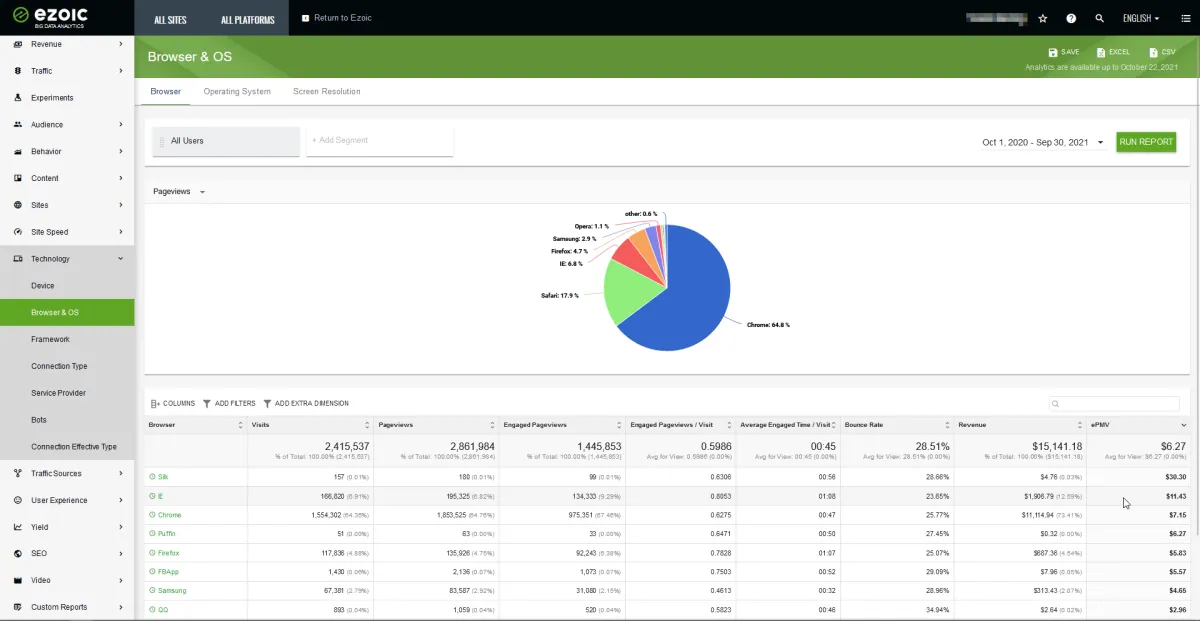
- 4) The browser used by visitors
- 5) The visitor's intent
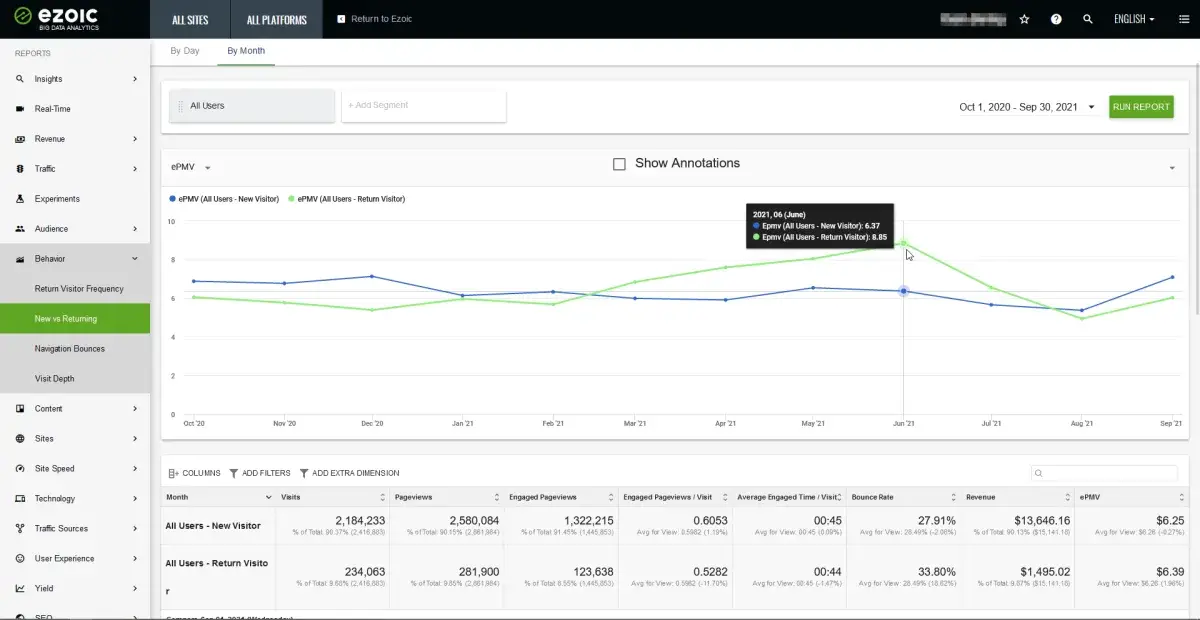
- 6) Whether it is a returning or new visitor
- 7) The visitor connection (Wi-Fi vs mobile data)
- 8) The time of day of the visit (during office hours or later in the evening)
- Factors Within the publisher's control
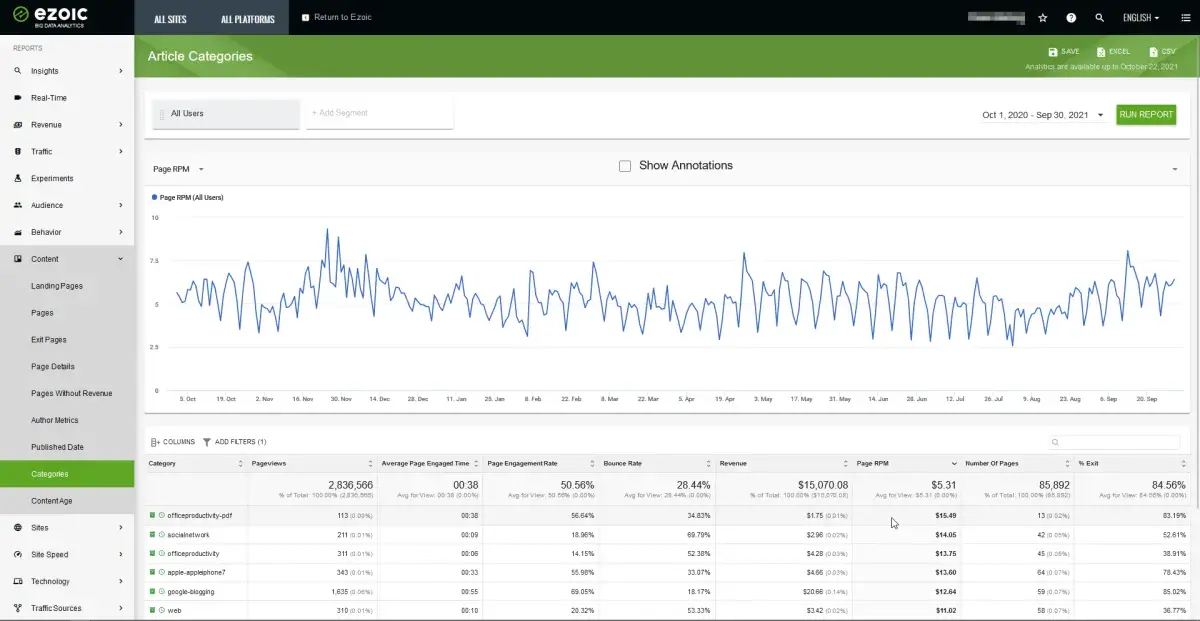
- 9) The type of content and content niche (news vs. how-to info articles)
- 10) Ad placement, ad formats, ad density, and ad size
- 11) Your visitor engagement
- 12) Your navigational links
- Conclusion
- Frequently Asked Questions
As an online publisher who has signed up with Ezoic to monetize your website, you're probably wondering about your site's performance. Based on the Ezoic EPMV Chart for your website, you're wondering how you can optimize your ad revenue further. Well, this article will help you to explain further about the Ezoic EPMV Chart and how you can further optimize your site for maximum ad revenue.
What is EPMV
EPMV stands for Earnings Per Thousand Visitors. To put it simply, EPMV shows how much ad revenue you earn per thousand visitors across your entire website. It is not a measurement of a particular page or ad unit.
Why CPC and CPM rates are not enough for publishers
As a publisher, you'd probably heard of CPC and CPM, which are advertising pricing units, that advertisers pay the ad network, and in turn, they pay you. CPC stands for cost per click and CPM stands for cost per thousand impressions for ads shown on your website. However as a publisher, just knowing the rates of the ads are not enough, as the metrics are more useful for the advertiser than the publisher.
On a single page of your website, you probably have more than one ad shown. More likely it is three or more ads shown per page. So, for instance, for every one thousand visitors that visit that page, they would have viewed three ads.
How to Calculate Ezoic EPMV
If a single ad is worth $0.05 CPM, for 3 ads on a page, this would amount to $0,15 eCPM (effective CPMs) for the 3 ads shown per page per thousand visitors.
Would it be enough then to say for 10,000 visitors, the revenue for the publisher would then be 10,000 x $0.15=$1,500 ?
That is not the complete picture for the publisher to calculate their website revenue. This is because visitors may view more than a single page. Some visitors can visit 2 or 3 pages in a single session.
Add that to the remaining 50% of visitors who would only visit a single page per session, which would be 5,000 visitors x 1 page x $0.15= $750.
So the total ad revenue would be $2.250+$750 = $3,000 total ad revenue. The total ad revenue of $3,000 is now divided by 1,000 visitors, which makes the EPMV to be $3 for one thousand visits. This effectively means you earn $3 per thousand visitors.
Contrast that to using just eCPM which would only be $0.15 eCPM.Therefore, using the EPMV method means that the ad revenue is better reflected than just using the CPM method.
Benefits of EPMV
The benefits are better user experience and higher page views overall. Let me explain further.
As a publisher, if you had only used the metric eCPM, then you would want to increase your eCPM rate. How can you do that? By putting more ads per page. It's well known that ads on a website can impact the user experience. Simply put, it would reduce their enjoyment of visiting your website. More often, they will leave your website just after visiting a single page.
In contrast, if you base your decision on EPMV, then you would want your visitors to visit as many pages per session. To do this, you would want to improve the user experience, which among others, means that you do not want to have too many ads per page. Instead, you would encourage your visitors to click on the internal links of your page.
When visitors visit many pages per session, it would reduce your bounce rate which is calculated in Google Analytics. A lower bounce rate (67% or less) is good for SEO as it is a good indicator for Google to rank your page higher, as Google has listed the user experience as one of the components of their page rankings.
So now you understand EPMV and why it matters, let's move on to the topic of Ezoic EPMV Chart.
What is Ezoic EPMV Chart
Ezoic is very transparent in its pricing to publishers with its Ezoic EPMV Chart. Even Google AdSense does not have the same transparency. Ezoic publishes the Online Ad Revenue Index, which shows a historical graph of daily ad rates, dating back to 2017. The US chart is widely available for all visitors, whereas you need to sign up to be an Ezoic user to view charts for other countries.
The Ezoic EPMV chart is built and owned by Ezoic, as Ezoic is a technology platform that is Google certified publishing partner. The purpose of the chart is to enable online publishers to optimize their websites to earn additional advertising revenues. However, Ezoic currently only has the following countries in their index: the United States, United Kingdom, France, Germany, and India.
EPMV Per Location
Not all website visitors are equal. Your website audience's country location matters. Visitors from tier-1 countries often have higher EPMC and eCPM which can be seen from the Ezoic EPMV chart. This is because the more the advertisers pay, the more the publishers receive ad revenue. Advertisers in higher-income countries pay more than in lower-income countries, and the advertisers in higher-income countries would want to advertise mainly to their own countries. So visitors from the respective high-income countries will see their ads, which are more relevant to the visitors and advertisers alike.
Even within those tier-1 countries, some countries have higher rates. Typically, the US has higher advertising rates than the UK and other European countries. So, knowing where your visitors come from is important information to determine your EPMV.
Having said that, however, it would seem that the US online advertising rates have dropped in 2020 during Covid compared to the prior year 2019. This also means that certain European countries' advertising rates are higher than the US during Covid.
Ezoic has explained that this is due to the drop in the live sports event during Covid, even though eCommerce has rapidly risen during the same period. It can be concluded that live sports events advertisers pay high advertising rates.
EPMV Per Visitor
EPMV per visitor could also change and fluctuate. Setting aside their geographical location, as already discussed in the above section, numerous factors can impact your EPMV. These can be divided further into two main categories:
Factors Outside The Publisher's Control
- 1) The season or month
- 2) The visitor's device type
- 3) The traffic source of visitors (e.g. social traffic vs SEO traffic)
- 4) The browser used by visitors
- 5) The visitor's intent
- 6) Whether it is a returning or new visitor
- 7) The visitor connection (Wi-Fi vs mobile data)
- 8) The time of day of the visit (during office hours or later in the evening)
Factors Within The Publisher's Control
- 9) The type of content and content niche (news vs. how-to info articles)
- 10) Ad placement, ad formats. ad density, and ad size
- 11) Your visitor engagement
- 12) Your navigational links
Factors OUTSIDE the publisher's control
1) The Season or Month impacting your Ezoic EPMV Chart
The advertising industry, in general, has the highest budget during the last quarter of the year, from October to December, and the lowest budget during the first quarter of the year, from January to March. The online advertising industry is no different and follows the same ad spending pattern. This is due to the higher consumer spending towards the last quarter of the year, such as Black Friday in November and Christmas shopping during December.
So to determine whether your EPMV has decreased or increased, instead of just comparing it to the previous month, you would need to compare it to the same month of the previous year.
2) The visitor's device type impacting your Ezoic EPMV Chart
iPhone is well known for its priority on data privacy. So it is possible that users visiting your website on iPhone will cause you to have lower EPMV, as they are unlikely to see personalized ads. Personalized ads for each visitor increase the revenue for the publisher as the visitor is more likely to be interested in and click on the ad shown.
3) The Ezoic EPMV Chart is impacted by the traffic source of visitors
Whether your visitors found you via Google, or other search engines, or from social media, such as Facebook, Twitter, or others, can impact your EPMV. The bounce rates from social media traffic are higher than those from search engines.
This difference goes back to the intent of the users. Typically visitors from search engines, such as Google or Bing, found your website to solve a problem or to find the information they need. Hence, they will stay longer and may have higher page views per session. In contrast, visitors from social media are there to be entertained or do not have any particular need for their visit, and their social media user experience is interrupted with a visit to your site. Thus the visitor so will leave your website earlier.

4) The browser used by visitors
The type of browser also has an impact on your EPMV. Safari browser, on the iOS platform, reduces the impact of ads, as Safari users can change their settings to block popup ads. Another less popular browser, Opera, automatically blocks ads.
5) The visitor's intent
What is the purpose of the visitor? Is it to solve a problem, or find out information. Depending on the content they land upon, this will impact your EPMV.
6) Whether it is a returning or new visitor
A returning visitor is more likely to click on an additional page and has higher page views per session compared to a new visitor.
7) The visitor connection (Wi-Fi vs mobile data)
The visitor on Wifi connection is most likely to stay longer, or have higher page views than those on mobile data.
8) The time of day of the visit (during office hours or later in the evening)
Depending on your website niche, the time of day a visitor arrives at your website will also impact your EPMV.
Factors Within the publisher's control
9) The type of content and content niche (news vs. how-to info articles)
Ezoic has found that certain types of content perform better in terms of EPMV. Informational content (how-to articles) performs better than news content.
Based on Ezoic's case study of two similar, growing websites in the same niche, that have similar domain authority and web traffic, one website is performing much better than the other website, based on their EPMV. Even though their visitor traffic is similar, one website is performing at a much higher EPMV than the other. So what is the reason for this?
Ezoic discovered that for the website with the higher performing EPMV, their traffic mainly goes to the informational topics of how-to, whereas the other website mainly has traffic that goes to the news section.
To improve on the EPMV of the second website, Ezoic suggests that the second website adds more informational content in order to get more traffic to their informational section.
10) Ad placement, ad formats, ad density, and ad size
Ad placement is where you place the ads: at the header, below the title, in-page, sidebar, or above the footer. The prime areas are the above header, and below the title which are known as an above-the-fold section. This is because not all visitors will read or scroll to the bottom of the page and view all of the ads.
The ad formats also impact your Ezoic EPMV chart: display ads, native ads, sticky sidebar ads, anchor ads, inline ads, and vignette ads. The publisher is best advised to test the different ad formats and ad placements to find the most optimal results.
Ad density refers to how many ads per page. Just as we explained earlier, too many ads per page will reduce the user experience and cause the user to bounce off (leave the website) early on. This is another setting that the publisher should test out.
Ad size refers to the size of the ads. While most ads are responsive on mobile, the ads also impact your Ezoic EPMV chart.
11) Your visitor engagement
The visitor engagement metric is typically shown based on page views per session, and time spent on the website per session. It's simple to say that if visitors only stay on your site for a few seconds before leaving, then the website has low engagement. A longer time per session means that they'll see more ads on your website.
As a publisher, you do not have direct control over your visitor engagement. However, by using the Ezoic data analytics platform, you can determine which content pages have higher visitor engagement. By analyzing what factors contribute to the specific pages that have higher engagement, you can then duplicate the process to create another highly engaging content page.
12) Your navigational links
Are your navigational links clear? Can visitors look for additional articles to read based on your header menu? Are there blue links that visitors can see? While this may seem common sense, some websites use themes that do not have blue links or header menus, making it less likely for visitors to visit another page.
Conclusion
Understanding your Ezoic EPMV chart better it will help you, as a website publisher, to optimize your revenue ads.
Frequently Asked Questions
- What are the benefits of using the Ezoic EPMV metric?
- The main benefit for site owners is the ability to optimize your site to generate additional advertising revenue and attract a good audience for traffic.
- How stable is the EPMV per visitor metric?
- The EPMV metric per visitor is not stable and can change and fluctuate. In addition to their geographic location, numerous factors can affect your EPMV and need to be analyzed.
- What is EPMV?
- EPMV stands for Profit Per Thousand Visitors. Simply put, EPMV shows how much ad revenue you earn per thousand visitors to your entire site. This is not a measurement of a specific page or ad unit.
- What can publishers learn from an Ezoic EPMV chart, and how can it be used to optimize a site's revenue?
- An Ezoic EPMV chart provides insights into how different factors (like content changes, traffic sources, page design) impact earnings. Publishers can use this chart to identify patterns, test different strategies, and make informed decisions to optimize content and ads for maximum revenue.