Seasonality in Online Advertising: Ezoic Online Advertising Revenue Index
To understand how the ad revenue index works, you need to figure out what the ad revenue index is.
What is the ad revenue index?
In simple terms, this is a global, single specially created indicator by which you can understand the state of the online advertising market on any given day.
The idea for such an index came about when it became apparent that publishers often lack transparency about how their display ads stand in relation to the rest of the global market. Naturally, a lot of publishers suffer from various fluctuations in income, but many of them do not understand whether an increase or decrease) in income over a certain period of time is specific to their site or something that affects all sites at once.
This index takes a statistical sample of data from all sites (small to large) across all countries, indexes their ad revenues, and then displays them in real time.
Thanks to the creation of this index, advertisers can now easily determine whether the increase or decrease in their ad revenue is the result of universal market conditions or the result of something happening on their own site.
The ad revenue index was created by competent specialists from Ezoic. It's worth noting that Ezoic is a Google Certified Publishing Partner providing free machine learning to test and optimize their web assets.
Ezoic created this index so that publishers can independently understand and contextualize their own data.
How to read the ad revenue index?
This index is updated once a day at 09:30 PST. Of course, sometimes delays can occur, this is due to reporting on advertising, due to which the update may be later than the specified time, but still on the same day.
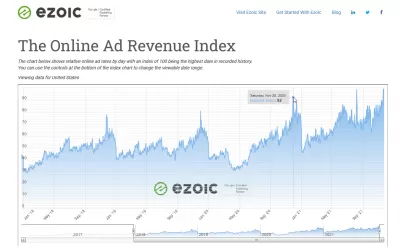
The value in the graph really means the EPMV's representation of thousands of online publishers, large and small, across all verticals.
It is worth saying that Ezoic is really confident that this is the entire market, as there is an idea of advertising pricing for a wide variety of publishers. In addition, the company employs highly qualified data scientists who were able to develop a unique method that primarily allows to characterize the daily fluctuations in online advertising revenue.
The value of the index may change, and this is due to the fact that on each new day, an assessment is laid out based on preliminary available data. On the second day, the collection of the necessary information and its processing ends, and then the information for the first day changes to the actual one. This is how the Ezoic Internet Advertising Revenue Index works.
Interesting takeouts from the ad revenue index
By using the buttons below the chart, it is possible to select the timeframe that you want to analyze.
What is very interesting is to compare online ad spend years over years, and see similarities in various situations.
For example, we can see that the global digital ad spend is getting larger by the year, and that it includes seasonality: advertisers are spending less at the beginning of the year, and are gradually spending more, with a peak at the end of each quarter, to finish marketing budgets, and the highest spend on BlackFriday at the end of November.
Therefore, by studying this graph, it is clear that if your website ad earnings are getting lower at some point, it might be due to advertisers spending less at the period.
And on the contrary, if you want to prepare for the largest possible display advertisement earnings, you should be ready for the end of November, and keep and big change on your websites for start of the year.
Frequently Asked Questions
- Is there seasonality for Ezoic advertising?
- Ezoic global digital advertising spend varies seasonally. For example, advertisers spend less at the beginning of the year and gradually spend more, with a peak at the end of each year. quarter to complete marketing budgets, and the highest spending on BlackFriday at the end of November.
