How To Check Instagram Post Analytics?
Instagram is a social network that lets you post photos and videos to your friends' news feeds. It's also the best way to find out what's going on in your friends' lives and it turns out that there are some ways to tell just how popular they are by looking at their posts on Instagram Analytics (IA).
In this post, we'll show you how easy it is to check out your IA account and see what kind of activity has occurred over time. We'll walk through each step of checking this information out so that you can make sure everything is running smoothly!
Step 1: Log in to https://flick.tech
To get started, log in to Flick with your username and password. Then click on the Add a widget button next to the Instagram logo at the top of your dashboard.
After you've added some widgets, go back to your dashboard and select Instagram Analytics from any of its submenus:
- From Dashboard > Tools > Instagram Analytics
- From Dashboards > Settings > InstaStats
Step 2: Click the Instagram logo
This will open up your profile page, where you can see all of your posts and how many people have liked them. If you click on your profile picture in the top-right corner, it will take you to a page where all of your followers are listed along with their names and pictures next to them. This is helpful if someone wants to know more about who's following them or what kind of content they post on Instagram!
Step 3: Enter your Instagram username
Enter your Instagram username or click on your profile picture at the top right of the page.
The next step is to enter your username. After you have entered it, a quick record of your activity will be shown below a graph that shows how many likes and comments each post has received over time, along with other information such as when it was posted and who shared it (if anyone). You can also click on any of these posts to see more details about them.
Step 4: The page will reload
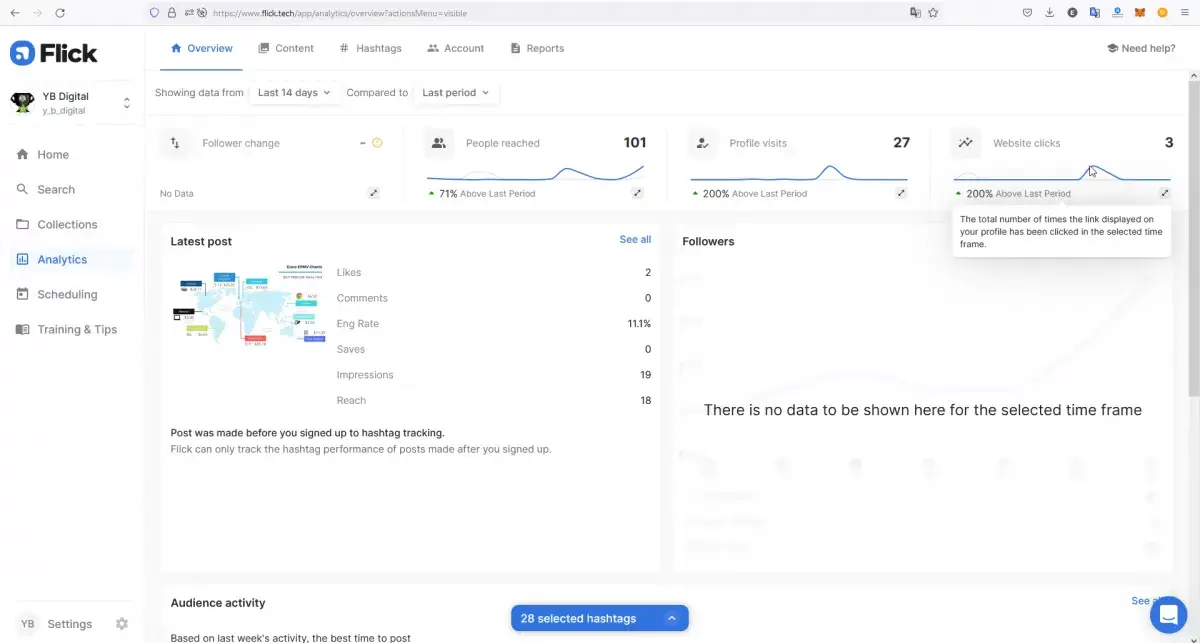
The page will reload and show you an overview of your activity over the past year. The number on the left is your total number of posts, and on the right, it's your number of likes.
- The “Post” section shows how many times you posted each day (and how many people liked them). Each day will be divided into three sections: days 1–3, 4–6, and 7–9. You can see if you had more than one post published on a given day by checking out this section labeled Posts.
- The “Likes” section shows how many times users liked or shared each post that day—if someone liked one of your posts but didn't share it with their followers as well as if they shared another user's photo instead! This also includes any comments made by others after viewing one of your photos/videos etc., which are indicated by asterisks next to their name when viewed in this area along with other information such as time stamp so users know exactly when they were posted online before anyone else saw them anywhere else outside Instagram itself --
Step 5: See a quick record of your activity
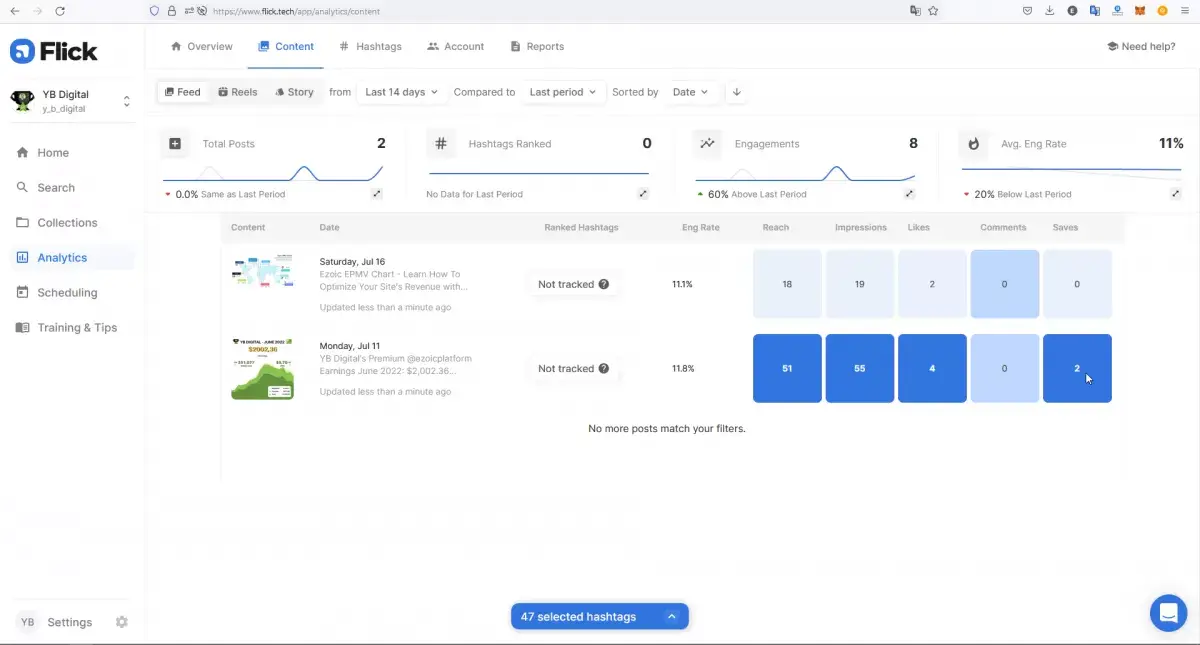
By clicking on any date on the upper graph, you can see a quick record of your activity on that day; each section shows you how many times you posted and how many people liked each post.
To see a breakdown of your activity on that day, you can click on any date on the upper graph. This will open a new window with your posts organized by date and time (recent posts are shown first).
By clicking on any date on this graph, you can see a quick record of your activity on that day. Each section shows you how many times you posted and how many people liked each post. You can also see a breakdown of your activity over the past year by selecting View All at the bottom right corner of this page.
Step 6: Scroll down past this graph to see a breakdown
The last thing we want to do is leave you with a bunch of numbers and not know how to interpret them. So, scroll down past this graph to see a breakdown:
Engagement Rate
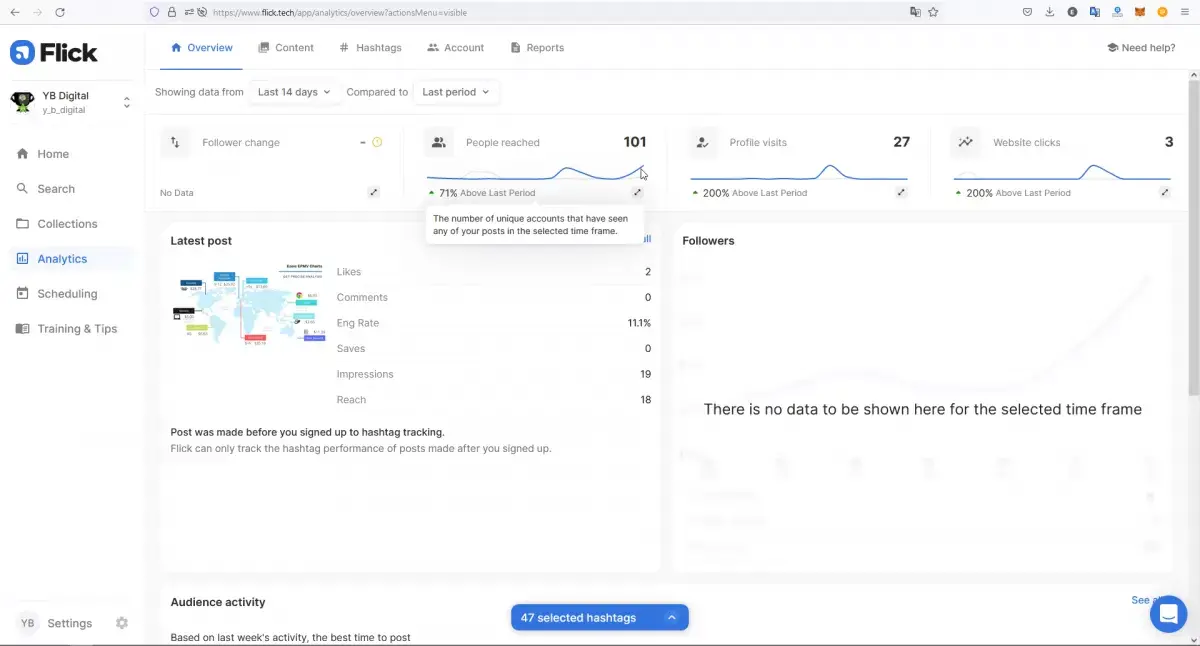
This shows you how many people have interacted with your posts (liking, commenting, etc.)
Reach
How many people have seen your post or Instagram Story?
Followers
How many followers do you have (and what percentage of them are active)?
Audience Size
How large is our audience size in total? This number will vary depending on what kind of content we're posting at any given time.
Conclusion
We hope you enjoyed this quick guide to Instagram account analytics. It's a great way to get a better understanding of what your audience finds interesting on the platform, as well as how they interact with your posts. You may be surprised by some of the insights you find!