YB.DIGITAL Website Content Media Network Earnings Evolution with Display Advertisement: April Report Shows Increased EPMV but Decreased Overall Earnings
- April Report Analysis:
- Revenue Breakdown:
- Ezoic Ad Partners:
- AdSense Mediation Earnings:
- Premium Ad Partners Revenue:
- Comparing April to March:
- EPMV:
- Earnings:
- Chart Analysis: Top 10 Countries - Visits, Revenue, and ePMV
- Germany:
- France:
- Poland:
- Netherlands:
- Chart Analysis: Top 10 Weather Categories - Visits, Revenue, and ePMV
- (Unknown):
- Clear Sky:
- Overcast Clouds:
- Broken Clouds:
- Few Clouds:
- Conclusion:
- Frequently Asked Questions
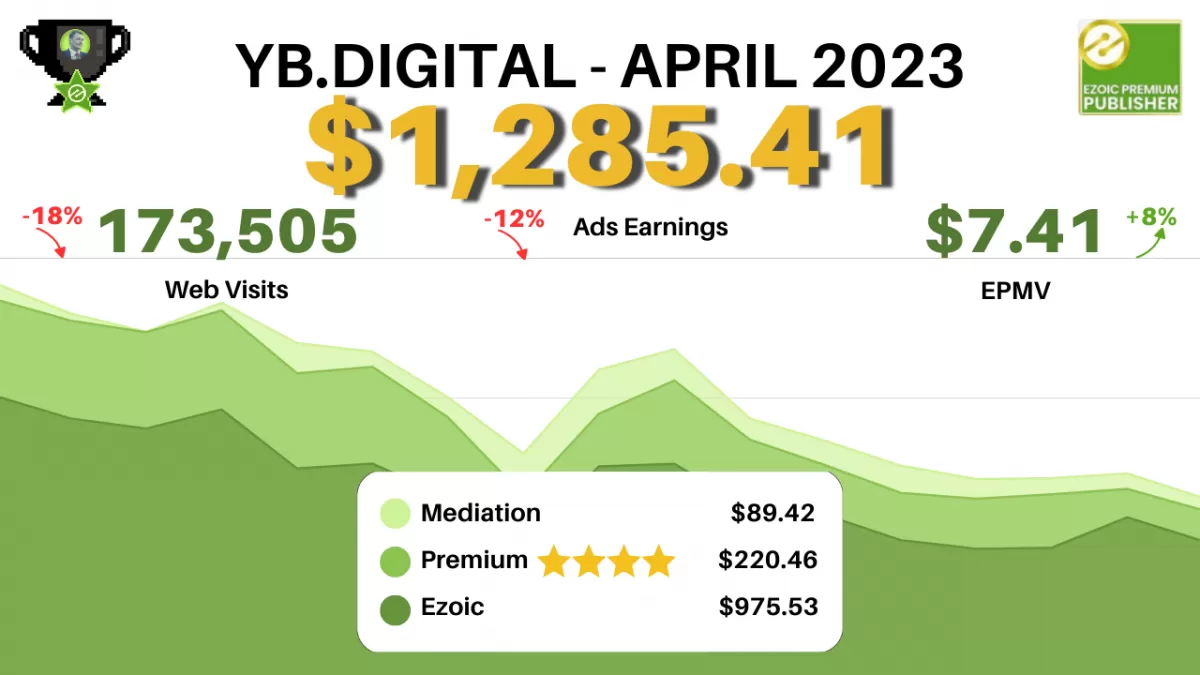
April Report Analysis:
In April, the website's EPMV witnessed a significant increase, reaching $7.41, compared to $6.89 in March. This rise in EPMV indicates improved monetization efficiency and potential revenue generation for the website.
However, despite the positive trend in EPMV, the website's overall earnings experienced a decline. In March, the earnings amounted to $1,457.55, but in April, they fell to $1,285.41. Although the EPMV rose, other factors such as changes in traffic volume or seasonality might have contributed to the decrease in earnings.
Revenue Breakdown:
Let's delve into the revenue breakdown for April to understand the sources of earnings for the website. The following figures represent the contributions of different ad partners to the overall revenue:
Ezoic Ad Partners:
The Ezoic ad partners played a significant role in revenue generation, contributing $975.53 to the total earnings. Ezoic's advanced optimization techniques and ad placement strategies likely contributed to this substantial portion of the revenue.
AdSense Mediation Earnings:
The website also utilized AdSense mediation, which resulted in earnings of $89.42. AdSense mediation helps maximize revenue by allowing multiple ad networks to compete for ad impressions, ensuring the highest paying ads are displayed.
Premium Ad Partners Revenue:
Furthermore, premium ad partners contributed $220.46 to the website's earnings. Collaborating with premium ad partners can provide access to high-quality advertisers, resulting in increased revenue potential.
Comparing April to March:
When comparing April's report to the previous month, our March earnings report, there are notable changes in both EPMV and overall earnings.
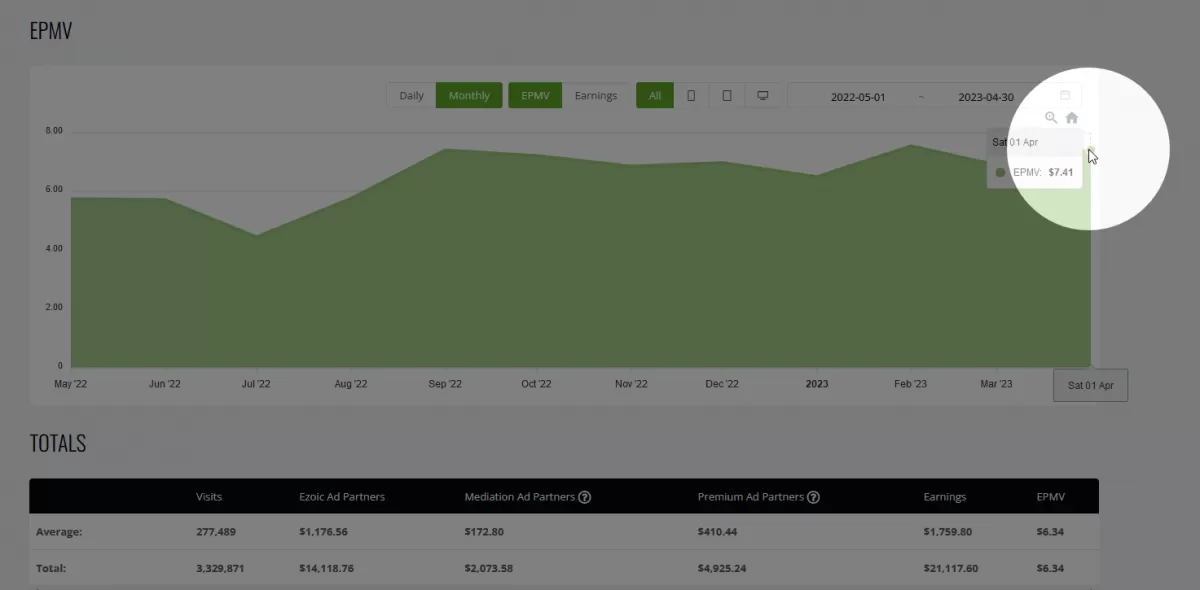
EPMV:
The EPMV increased from $6.89 in March to $7.41 in April, reflecting an improvement in the monetization efficiency. This rise suggests that the website's ad strategies and optimization techniques implemented in April were successful in generating higher revenue per thousand visitors.
Earnings:
However, the website's overall earnings experienced a decline. In March, the earnings amounted to $1,457.55, but they decreased to $1,285.41 in April. Several factors, mostly changes in traffic volume or seasonality with search intent, may have contributed to this decrease in earnings.
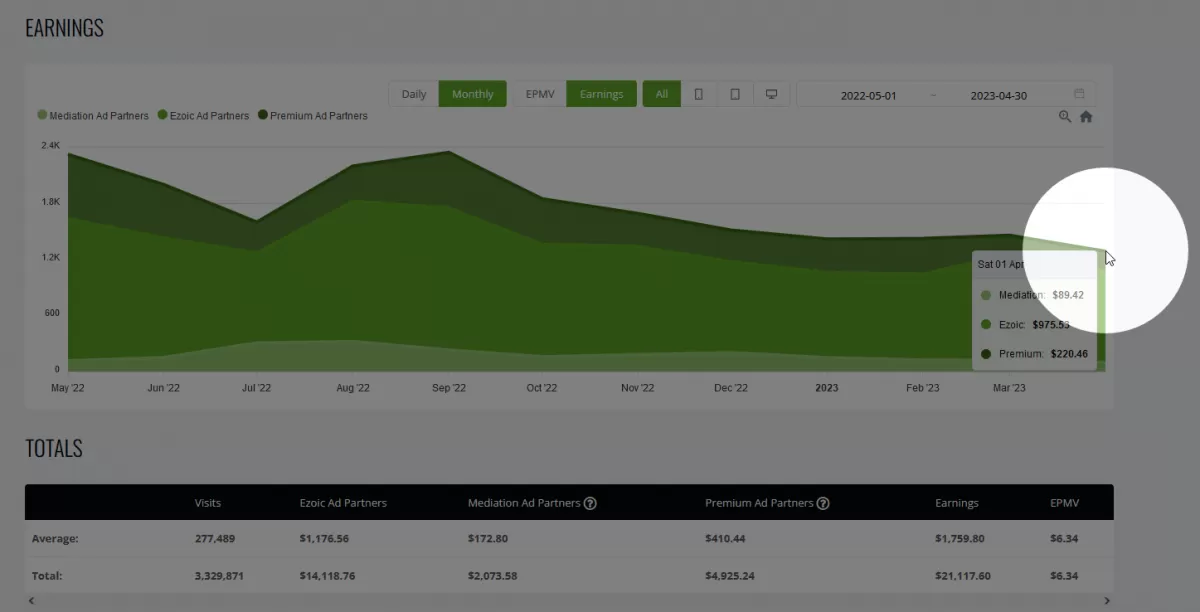
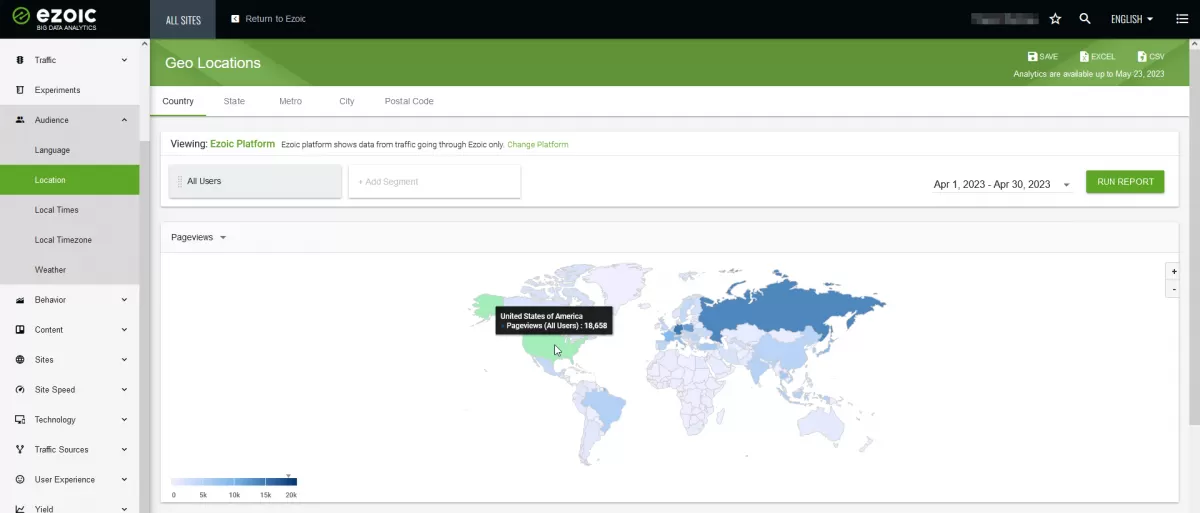
Chart Analysis: Top 10 Countries - Visits, Revenue, and ePMV
The following chart presents data on the top 10 countries based on visits, revenue, and ePMV (Earnings Per Thousand Visitors). This information provides insights into the performance and contribution of different countries to the website's earnings.
subtitle United States:
The United States had the highest number of visits with 16,731, accounting for 9.63% of the total visits. In terms of revenue, it generated $271.35, which represented 21.43% of the total revenue. The ePMV for the United States was $16.22, indicating a relatively high monetization efficiency.
Germany:
Germany ranked second in terms of visits, with 8,999 visits constituting 5.18% of the total visits. It generated $137.43 in revenue, accounting for 10.86% of the total revenue. The ePMV for Germany was $15.27, demonstrating a strong revenue generation per thousand visitors.
France:
With 5,665 visits, France contributed 3.26% to the total visits. It generated $87.35 in revenue, representing 6.90% of the total revenue. The ePMV for France stood at $15.42, indicating a favorable monetization efficiency.
Poland:
Poland accounted for 3.81% of the total visits with 6,626 visits. In terms of revenue, it generated $44.64, representing 3.53% of the total revenue. The ePMV for Poland was $6.74, suggesting a relatively lower monetization efficiency compared to the previous countries.
Netherlands:
Optimize your site
Increase ad revenue 50-250% with Ezoic. A Google Certified Publishing Partner.
Maximize revenue
With 3,575 visits, the Netherlands contributed 2.06% to the total visits. It generated $42.64 in revenue, accounting for 3.37% of the total revenue. The ePMV for the Netherlands was $11.93, indicating a moderate level of monetization efficiency.
It's worth noting that the remaining countries in the top 10, including Sweden, United Kingdom, Japan, Italy, and Canada, also made significant contributions to visits, revenue, and ePMV. These countries exhibited varying levels of performance in terms of monetization efficiency, revenue generation, and visitor engagement.
Analyzing the data from different countries allows for a better understanding of the website's global reach and revenue distribution. It also highlights the importance of focusing on high-performing countries and optimizing monetization strategies to maximize overall earnings.
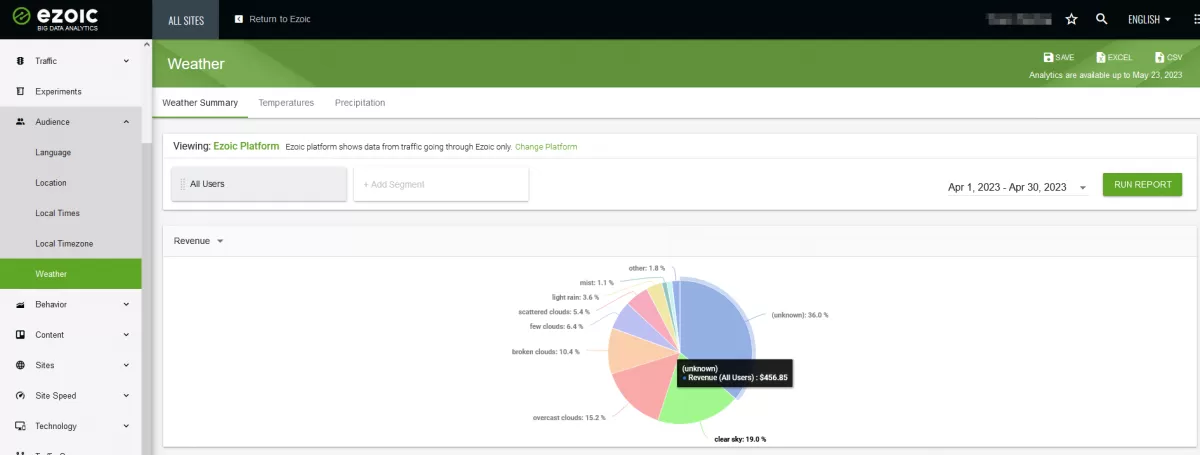
Chart Analysis: Top 10 Weather Categories - Visits, Revenue, and ePMV
The following chart provides an overview of the top 10 weather categories in terms of visits, revenue, and ePMV (Earnings Per Thousand Visitors). This data offers insights into the performance and monetization potential of different weather conditions on the website.
(Unknown):
The Unknown weather category had the highest number of visits, with 97,596 visits, accounting for 55.58% of the total visits. In terms of revenue, it generated $456.85, representing 36.04% of the total revenue. The ePMV for this category was $4.68, indicating a relatively lower monetization efficiency compared to other weather conditions.
Clear Sky:
The Clear Sky category ranked second in terms of visits, with 22,809 visits, constituting 12.99% of the total visits. It generated $240.52 in revenue, accounting for 18.97% of the total revenue. The ePMV for Clear Sky was $10.55, indicating a relatively higher monetization efficiency compared to the Unknown category.
Overcast Clouds:
With 17,244 visits, the Overcast Clouds category contributed 9.82% to the total visits. It generated $192.15 in revenue, representing 15.16% of the total revenue. The ePMV for Overcast Clouds was $11.14, suggesting a favorable monetization efficiency.
Broken Clouds:
The Broken Clouds category accounted for 7.40% of the total visits, with 12,991 visits. In terms of revenue, it generated $131.75, representing 10.39% of the total revenue. The ePMV for Broken Clouds was $10.14, indicating a moderate level of monetization efficiency.
Few Clouds:
With 7,862 visits, the Few Clouds category contributed 4.48% to the total visits. It generated $81.62 in revenue, accounting for 6.44% of the total revenue. The ePMV for Few Clouds was $10.38, suggesting a similar monetization efficiency compared to the Broken Clouds category.
The remaining weather categories, including Scattered Clouds, Light Rain, Mist, Moderate Rain, and Haze, also made significant contributions to visits, revenue, and ePMV. Each weather condition exhibited varying levels of performance in terms of monetization efficiency and revenue generation.
Analyzing the data from different weather categories helps understand the website's audience preferences and the revenue potential associated with different weather conditions. It can also assist in optimizing content and ad strategies to target high-performing weather categories, maximizing overall earnings.
Conclusion:
April's report highlights a positive trend in EPMV, indicating improved monetization efficiency for the website. Despite this, the overall earnings decreased from March to April. Understanding the revenue breakdown, we observed that Ezoic ad partners, AdSense mediation, and premium ad partners all played significant roles in revenue generation. Analyzing these data points provides valuable insights for optimizing ad strategies and maximizing revenue in future months.
Frequently Asked Questions
- How can an increased EPMV, as shown in the April report, be aligned with sustainable digital marketing practices?
- An increased EPMV, as shown in the April report, can be aligned with sustainable digital marketing practices by focusing on high-quality, eco-friendly advertisements, and optimizing website efficiency to reduce energy consumption and digital waste.
- What could cause an increase in EPMV but a decrease in overall earnings?
- An increase in EPMV with a decrease in overall earnings could be due to lower overall traffic despite higher per-visitor earnings, emphasizing the need to focus on both traffic growth and monetization.
Yoann Bierling is a Web Publishing & Digital Consulting professional, making a global impact through expertise and innovation in technologies. Passionate about empowering individuals and organizations to thrive in the digital age, he is driven to deliver exceptional results and drive growth through educational content creation.
Optimize your site
Increase ad revenue 50-250% with Ezoic. A Google Certified Publishing Partner.
Maximize revenue