How to create interactive map in Google Sheets
Create interactive map in Google Sheets
Want to create a map chart to share, either by putting it online on your website like below, or sharing a picture ? And, on top of that, an interactive map?
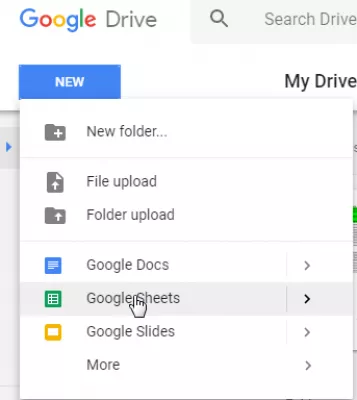
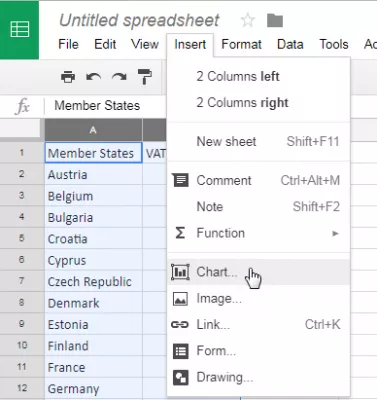
Step 1: create new sheet
This is very easy with Google Sheets. Start by going on your Drive, and select NEW > Google Sheets:
In the spreadsheet, paste your values:
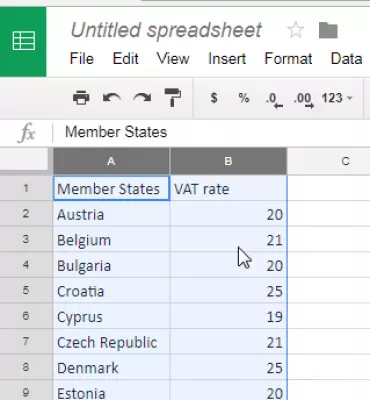
Select Insert > Chart…
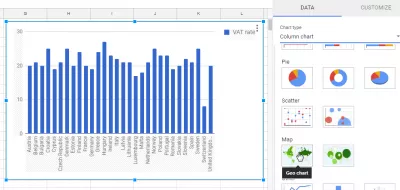
Step 2: create a map chart from a spreadsheet
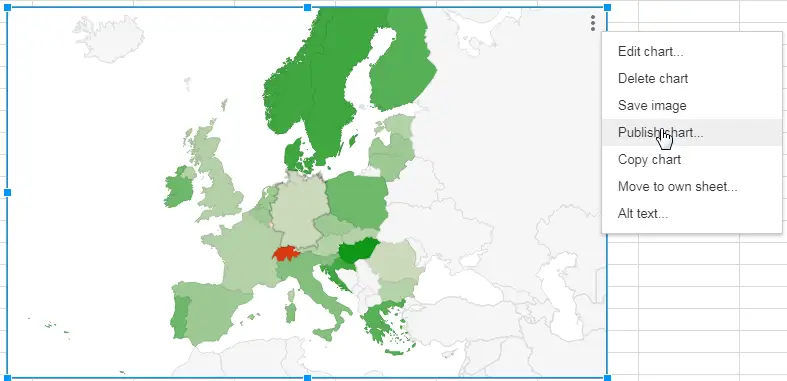
Your chart might be setup as a bar chart. To change it to a map chart, select the chart, click on the three dots in the top right corner > Edit chart… and in the Chart editor, in customize tab, Chart type, select Geo chart
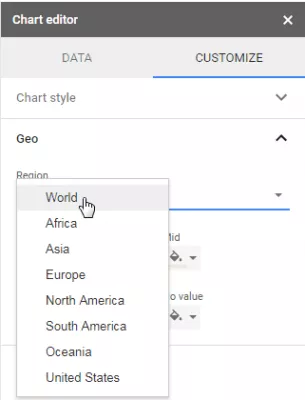
You can then select how you want your chart to be displayed with the different options.
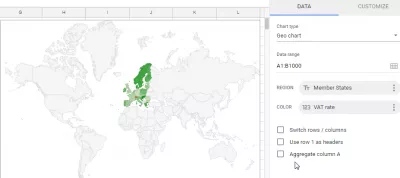
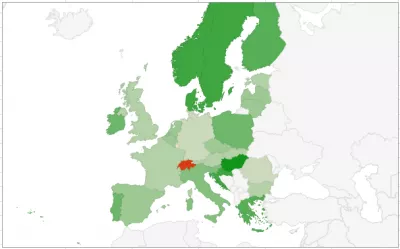
For example, change the world region to be displayed.
Result example when selecting Europe:
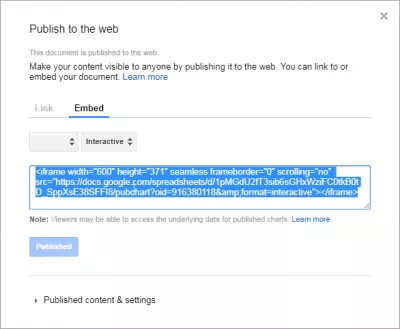
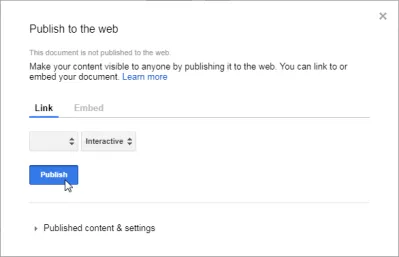
Step 3: publish interactive map chart
To publish your chart, click on the three dots, and select Publish chart…

You can also get a static image to share.
Get a link to send it to your contacts, or to share it on social networks
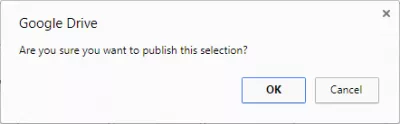
A box will ask you to confirm the publication:
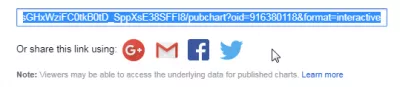
Step 4: share link or include in website
And link will be displayed, with quick links to share on common social networks like Google+, Gmail email, Facebook, and Twitter:
By going in embed, HTML data will be given to share on your website, as seen in the interactive chart above this article