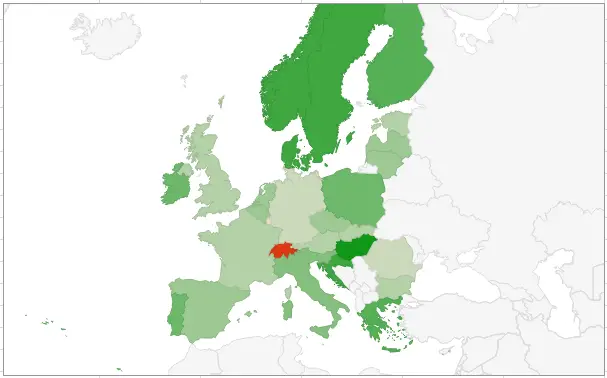
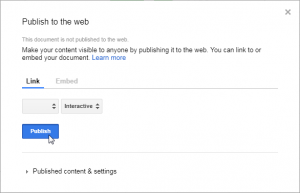
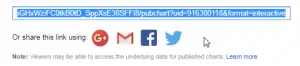
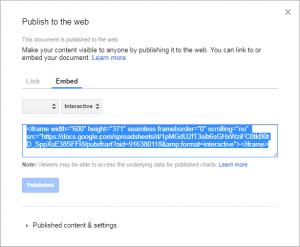
Want to create a map chart to share, either by putting it online on your website like below, or sharing a picture ? And, on top of that, an interactive map ?
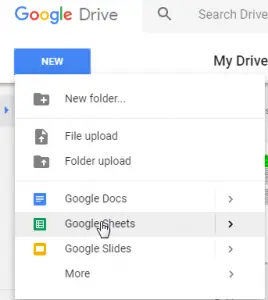
This is very easy with Google Sheets. Start by going on your Drive, and select NEW > Google Sheets
Create new spreadsheet in Google Docs
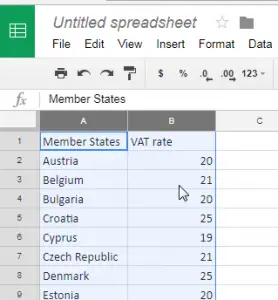
In the spreadsheet, paste your values
Paste data in Google Sheet
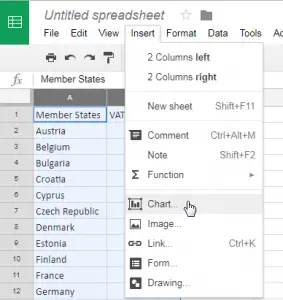
Select Insert > Chart…
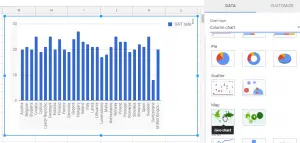
Create a chart in Google Sheets
Your chart might be setup as a bar chart. To change it to a map chart, select the chart, click on the three dots in the top right corner > Edit chart… and in the Chart editor, in CUSTOMIZE tab, Chart type, select Geo chart
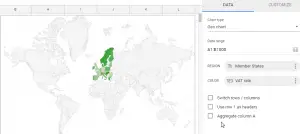
Change chart type in Google Sheets
You can then select how you want your chart to be displayed with the different options.
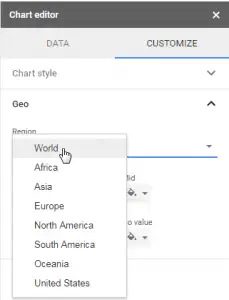
Customize a map chart in Google Sheets
For example, change the world region to be displayed.