Interactive maps of average gross salary, net salary, and income tax in Europe
In Europe, the disparities in terms of average salary and taxation can be wide.
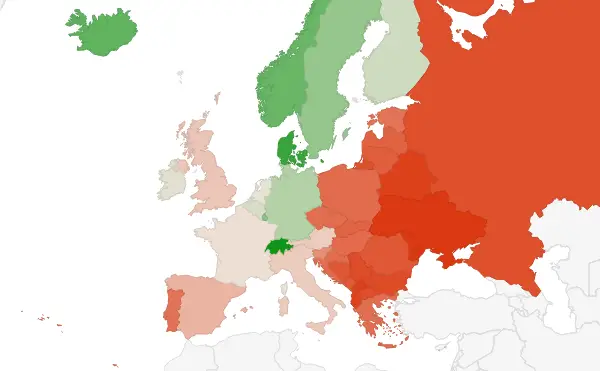
The highest average salaries, both net and gross, can be found in Switzerland, with some of the lowest income tax (5725€ gross, 17.9% tax, 4700€ net).
The lowest average salaries, both net and gross, can be found in Ukraine, with an income tax in the bottom of the list (230€ gross, 19.57% tax, 185€ net).
Average gross salary in Europe in Euros € :
Average net salary in Europe in Euros € :
The highest average income tax can be found in Denmark (40.67%), along with the 2nd highest average gross income (5225€), and the 4th highest average net income (3100€).
The lowest average income tax can be found in Cyprus (6.80%), with an average gross (1779€) and net (1658€) income in the middle of the European scope.
Average income tax in Europe :
See the full data taken from List of European countries by average wage – Wikipedia for most countries, and from Malta | 2016/17 Average Salary Survey for Malta
| Member States | Average gross salary in € | Average net salary in € | Average income tax |
| Albania | 397 | 330 | 16.88% |
| Armenia | 359 | 251 | 30.08% |
| Austria | 2555 | 2053 | 19.65% |
| Azerbaijan | 269 | 232 | 13.75% |
| Belarus | 361 | 314 | 13.02% |
| Belgium | 3261 | 2091 | 35.88% |
| Bosnia and Herzegovina | 666 | 429 | 35.59% |
| Bulgaria | 529 | 413 | 21.93% |
| Croatia | 1071 | 797 | 25.58% |
| Cyprus | 1779 | 1658 | 6.80% |
| Czech Republic | 1065 | 813 | 23.66% |
| Denmark | 5225 | 3100 | 40.67% |
| Estonia | 1153 | 958 | 16.91% |
| Finland | 3380 | 2509 | 25.77% |
| France | 2874 | 2157 | 24.95% |
| Georgia | 367 | 293 | 20.16% |
| Germany | 3703 | 2270 | 38.70% |
| Greece | 1092 | 917 | 16.03% |
| Hungary | 1027 | 683 | 33.50% |
| Iceland | 4725 | 3435 | 27.30% |
| Ireland | 3133 | 2479 | 20.87% |
| Italy | 2560 | 1762 | 31.17% |
| Kosovo | 360 | 330 | 8.33% |
| Latvia | 886 | 648 | 26.86% |
| Lithuania | 818 | 645 | 21.15% |
| Luxembourg | 4212 | 3009 | 28.56% |
| Macedonia | 540 | 368 | 31.85% |
| Malta | 2951 | 2261 | 23.38% |
| Moldova | 252 | 200 | 20.63% |
| Montenegro | 769 | 512 | 33.42% |
| Netherlands | 3073 | 2263 | 26.36% |
| Norway | 4635 | 3365 | 27.40% |
| Poland | 1034 | 736 | 28.82% |
| Portugal | 1158 | 846 | 26.94% |
| Romania | 726 | 522 | 28.10% |
| Russian Federation | 597 | 519 | 13.07% |
| Serbia | 538 | 391 | 27.32% |
| Slovakia | 897 | 690 | 23.08% |
| Slovenia | 1591 | 1038 | 34.76% |
| Spain | 2188 | 1718 | 21.48% |
| Sweden | 4078 | 3062 | 24.91% |
| Switzerland | 5725 | 4700 | 17.90% |
| Ukraine | 230 | 185 | 19.57% |
| United Kingdom | 2455 | 1960 | 20.16% |
See also
Cost of life comparator, by salary – Where Can I FLY ? Travel inspiration


